Fun With Maps: Hurricanes and Storm Tides (What If?)
in Writing on Tufts, Blog posts
Hurricanes are tricky things. According to the National Oceanic and Atmospheric Administration’s National Hurricane Center, 26 named storms (hurricanes, tropical storms, subtropical storms, or extratropical storms) have hit New England since 1900. We’ve become much better at tracking them and predicting their effects over that period, however: prior to 1990, the vast majority (over 90% worldwide) of deaths due to hurricanes and other tropical cyclones were drowning deaths due to increased tides and flooding, known as “storm surge.” Today, the majority of deaths are due to high winds, falling trees, electrocution, and other unpredictable hazards, according to the Centers for Disease Control and Prevention.
Although we’ve become better at predicting the effects of hurricanes, that doesn’t mean we’ve mitigated them. A Category 5 hurricane will still do “catastrophic” damage to man-made structures, and, as we have repeatedly seen, putting up defenses like levees or seawalls doesn’t guarantee safety, either. Fun fact for those of you thinking that only Cat5 hurricanes are dangerous: when Katrina made landfall in 2005, it was classified as a Category 3 storm.
Hurricane Sandy, which has recently savaged most of the Atlantic Coast and parts of New England (and is the largest tropical cyclone on record), made its way through Boston on Monday, causing Tufts to cancel classes. Some people did homework. I modeled the worst-case storm tides for the New England basin and made maps of them at different levels of hurricane intensity.
Storm surge is especially dangerous in low-lying areas with populations close to the shore. New England is actually fairly resilient to storm surges because of its deep-water coastline, while shallow sloping coasts like those along the Gulf coast create storm surges 50 feet high and can flood for miles inland. This website has a good, plain English explanation (with animations!) of storm surge dynamics.

Storm surge modeling is important because it allows forecasters and government agencies to make decisions about evacuations, resource allocation, and even planning and flood insurance. If a house is built along the coast in an area that would be flooded by storm surge if a hurricane hit, flood insurance will be more expensive based on the added risk.
For me, though, it’s just for fun. I love maps, I love seeing data graphically, and I love data!
So here are my maps! Remember, these are worst-case maps, based on NOAA’s SLOSH storm surge model, which does not account for rainfall during a storm as that varies significantly based on storm and watershed; do not use them to make evacuation decisions (or really, any decisions – if you are in a decision-making capacity you really ought to have maps of your own). Real forecasters use many models and take many different variables into account. My maps use freely available geographic data from MassGIS, USGS, and NOAA.
NGVD88 is the National Geodetic Vertical Datum of 1988 – essentially mean sea level, although it’s a little more complicated.
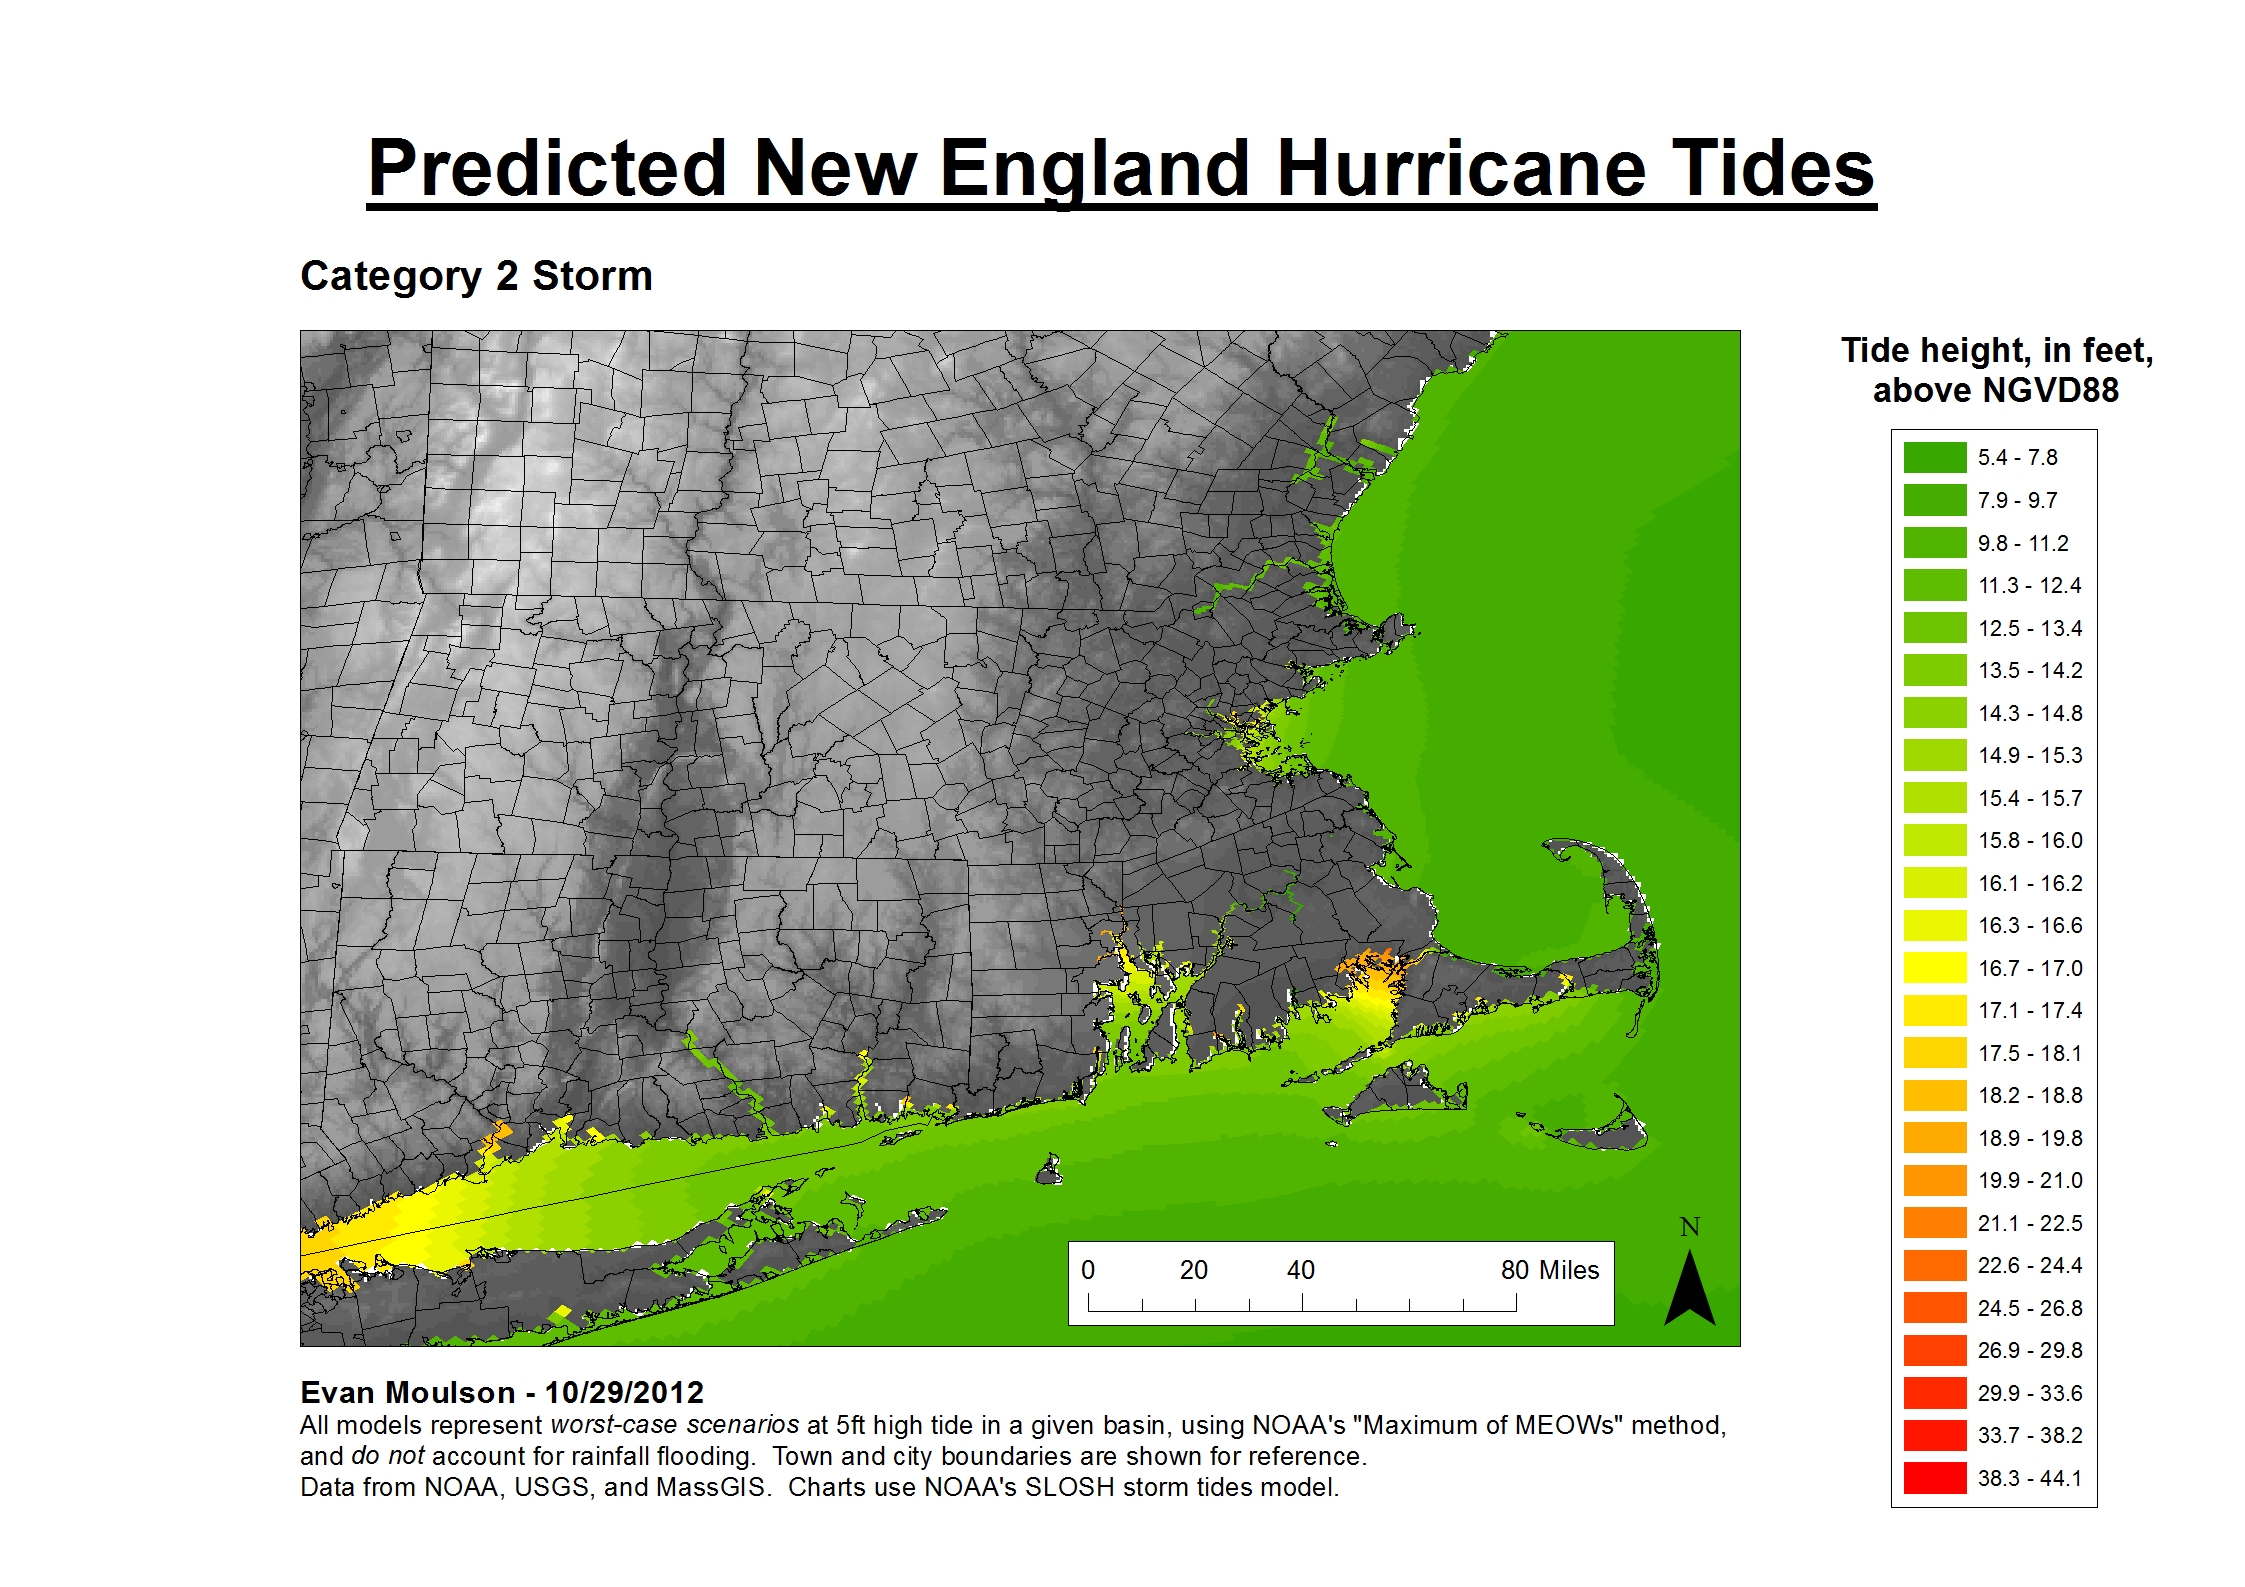
All of the maps have the same color scale, so you can see that a Category 1 storm produces some flooding in coastal areas, but really doesn’t raise the sea level very much or cause much inland flooding, compared to larger storms. Most of the flooding is contained to coastal areas and rivers in the Boston area, Connecticut, and Rhode Island will rise between 6 and 8 feet above sea level.

A Cat2 storm produces some serious flooding in western Connecticut, Rhode Island, and southern Massachusetts around the Sagamore Bridge. Still not too much inland flooding to worry about, although there may be significant floods in southeastern Massachusetts near Cape Cod and Buzzard’s Bay. Providence and Hartford also look like they’re in for some serious flooding, with sea levels rising up to 20 feet in some places.
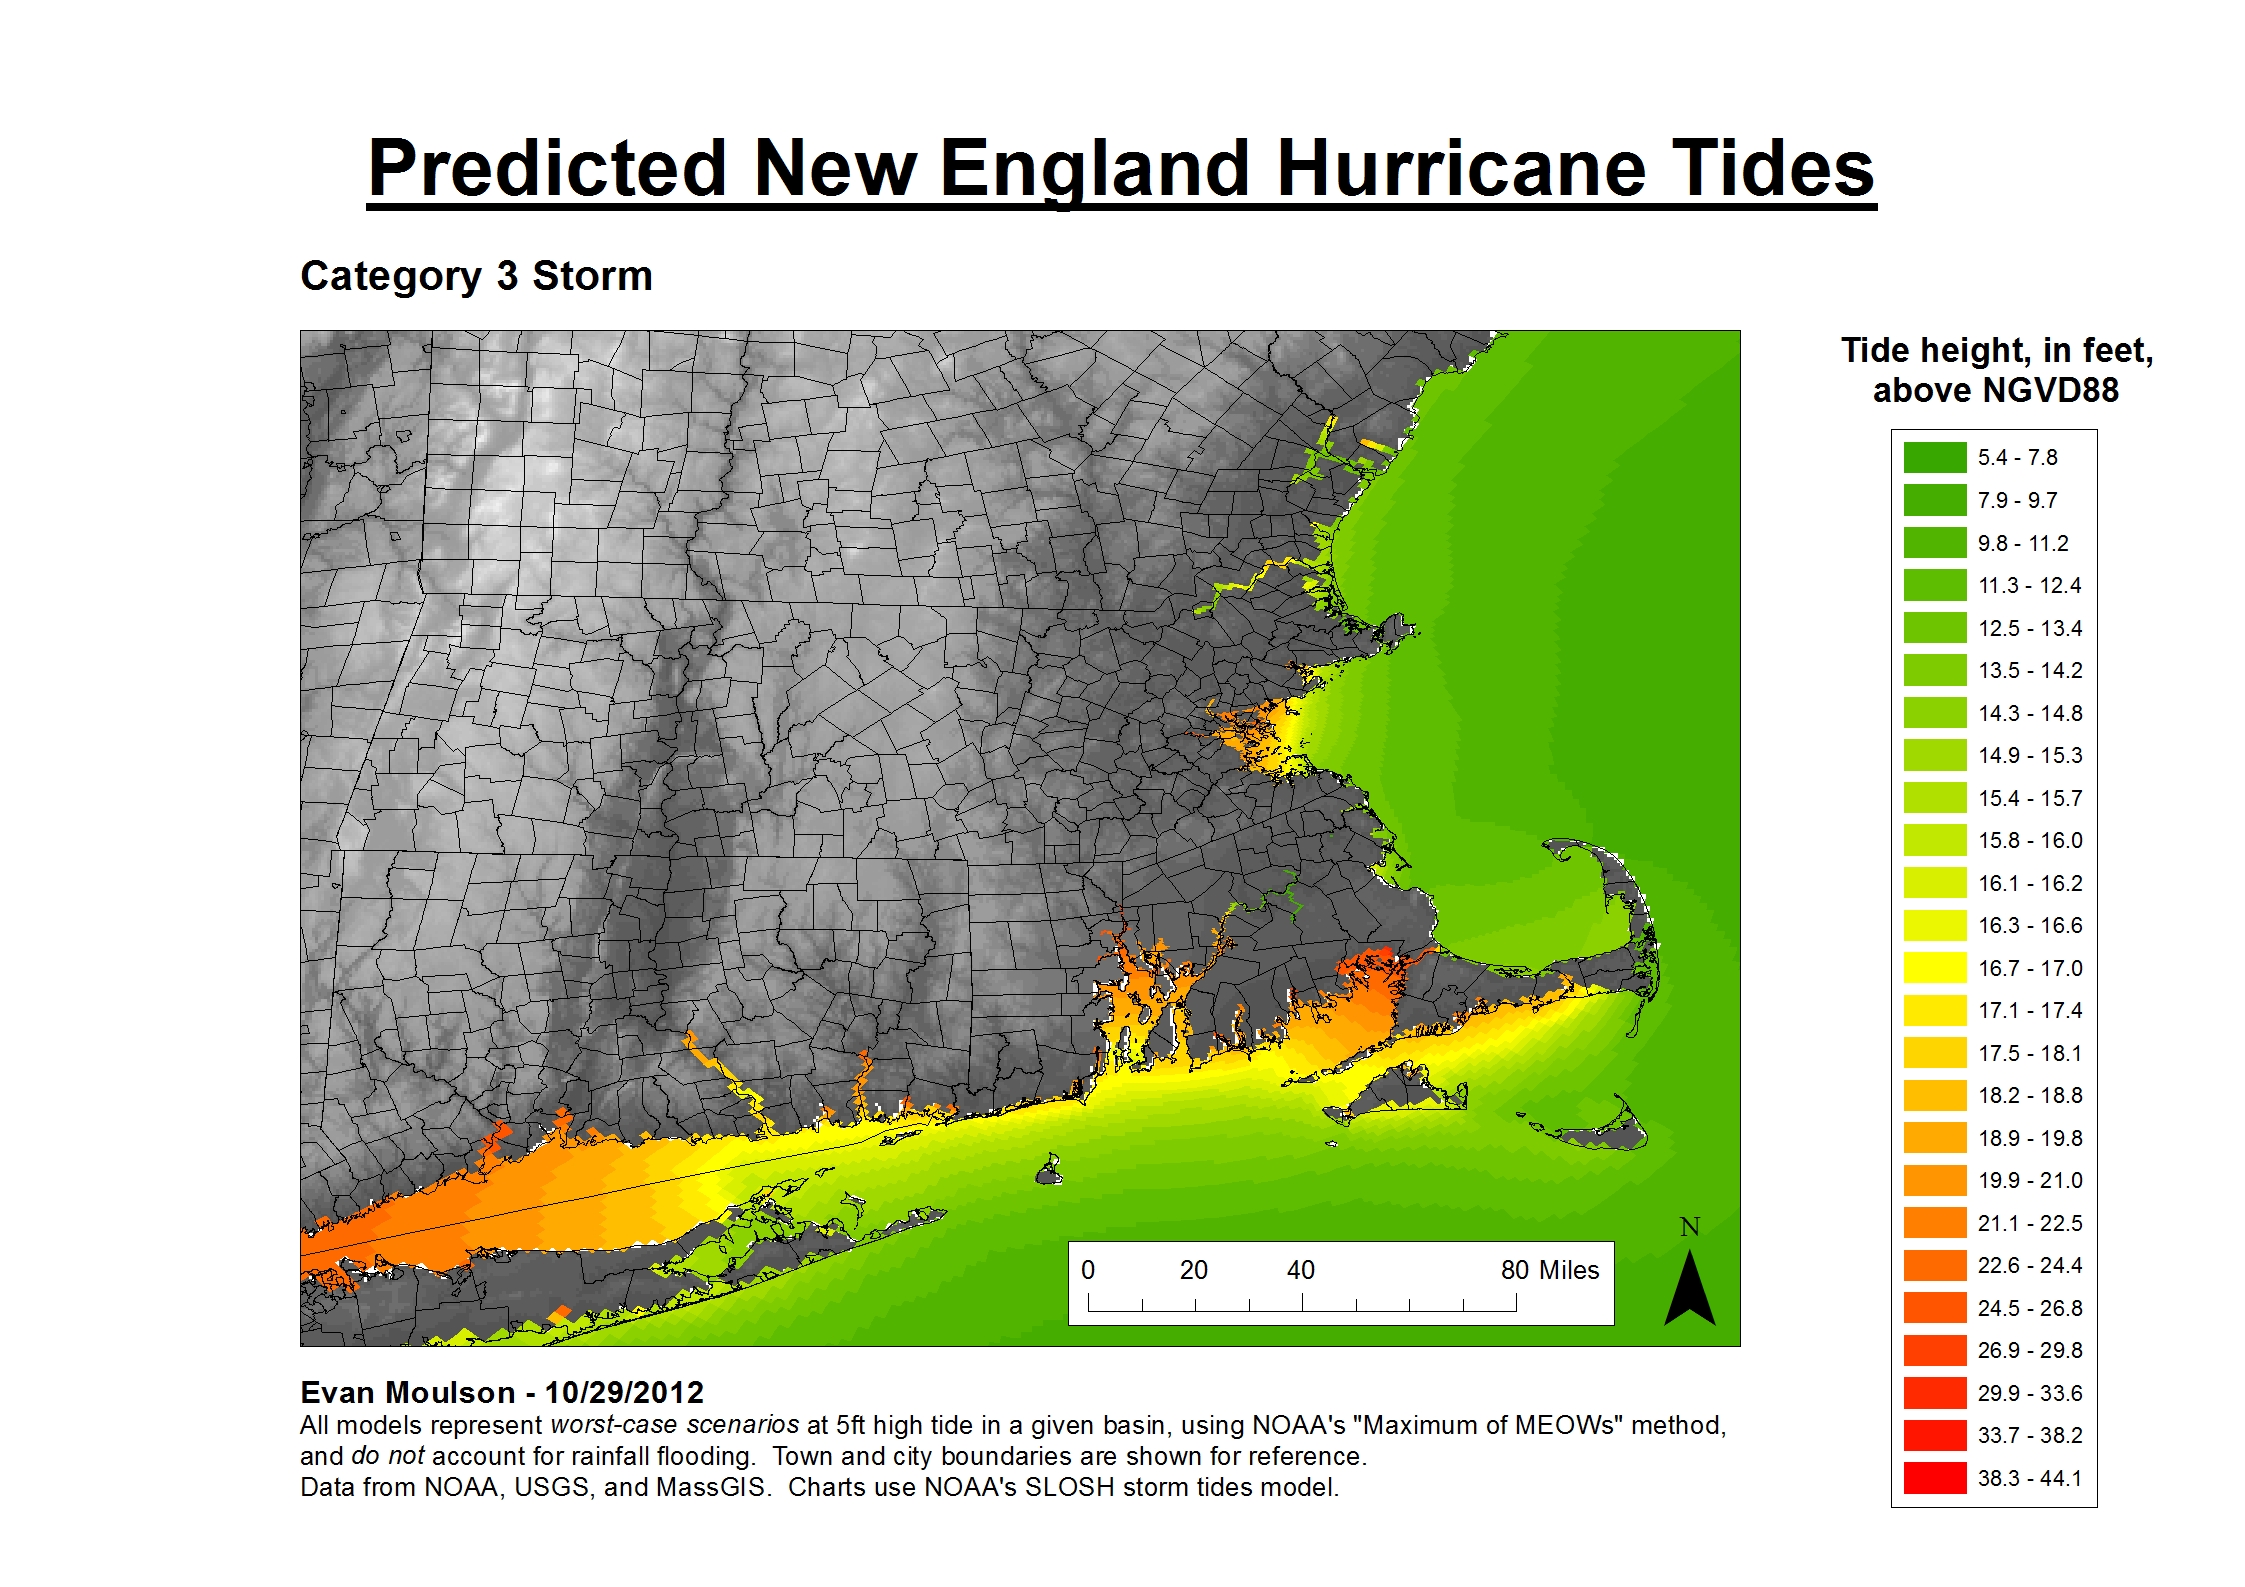
A Cat3 storm presents heavy flooding all along the southern coast of New England and even floods Boston Harbor. In this scenario, the Charles River would be flowing about 30 feet higher than sea level (similar numbers can be quoted for the Mystic River near Tufts). At this point, significant portions of Boston, Cape Cod, southern Massachusetts, and Connecticut are underwater. Almost the entire town of Wareham, MA has become a swimming pool.
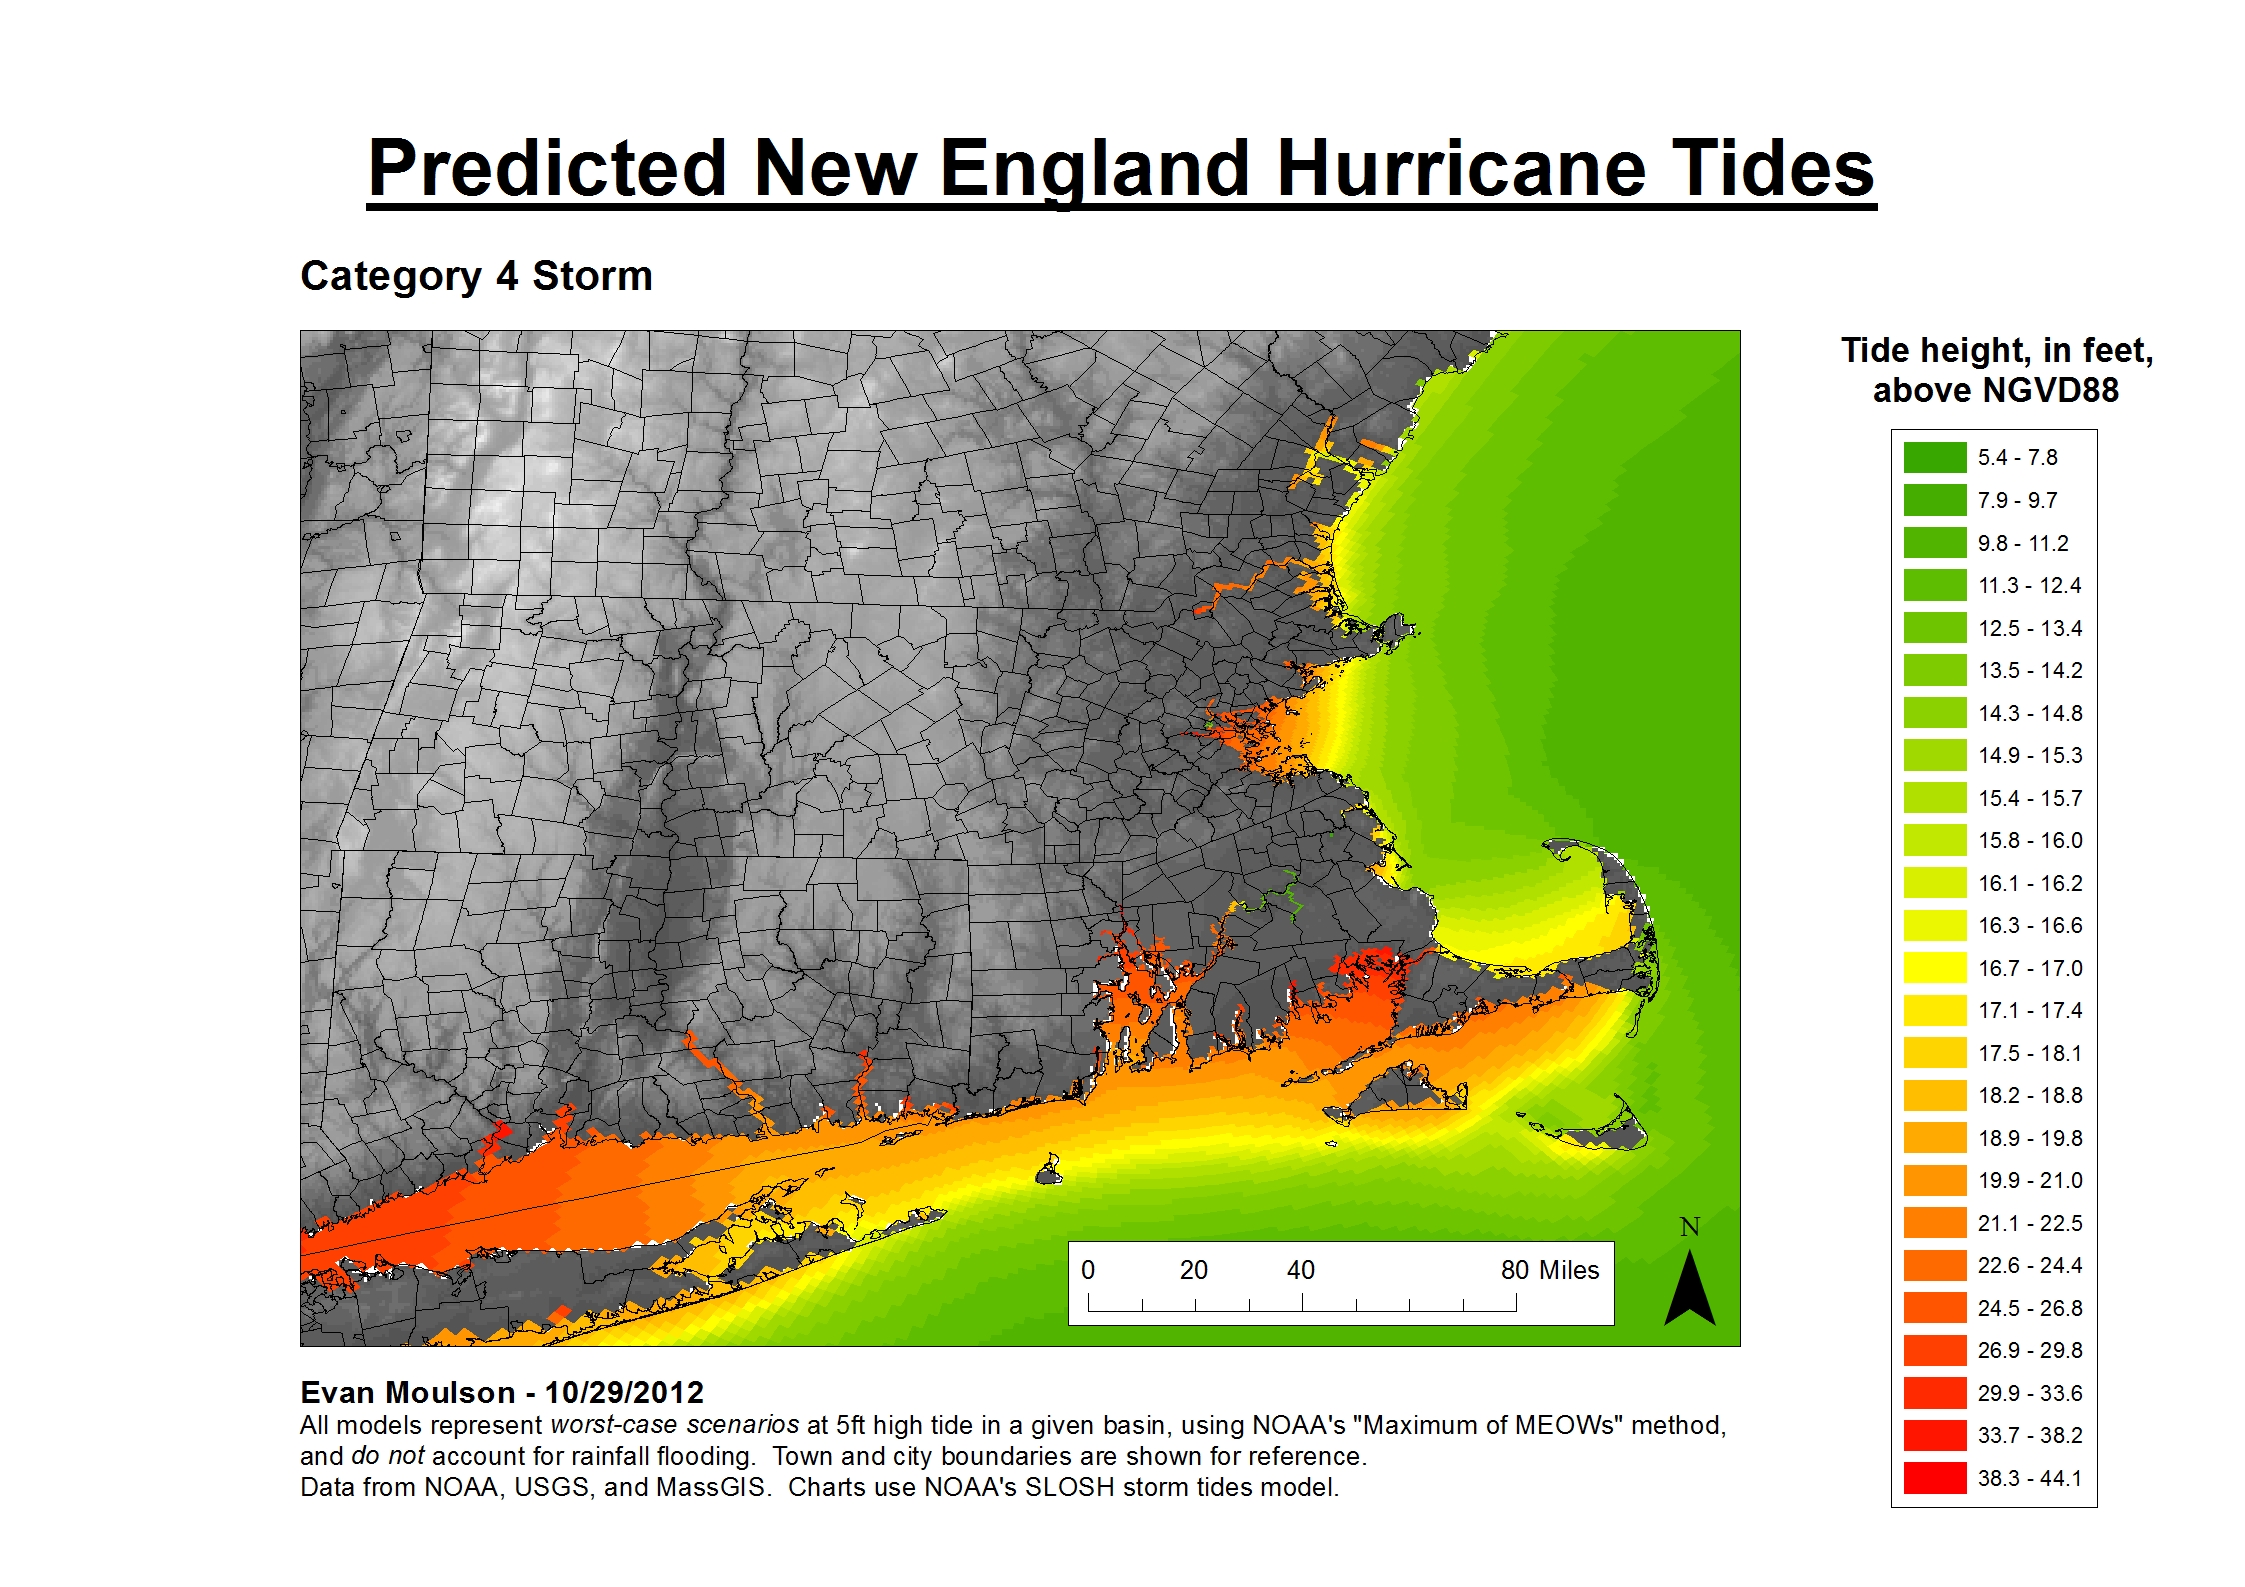
A Cat4 storm, the highest NOAA’s models go for the Northeast basin, would be catastrophic. The Sagamore Bridge connecting Cape Cod to the mainland would likely be washed away, there is significant inland river flooding in southern Massachusetts – just from storm surge, not even from rainfall – and many of the towns along the southern coasts of Massachusetts, Rhode Island, and Connecticut have been entirely swept away by tides that rise up to 45 feet above sea level. Even New Hampshire and Maine are getting in on the action: Portsmouth, NH is likely experiencing severe floods up to 40 miles inland, and southern Maine all the way up to Portland will see heavy flooding. Some of the least likely places to be flooded are not the ones you’d think: Nantucket experiences only relatively mild storm surge along its western coast (“relatively mild” is used here to mean up to 20 feet above sea level), while Provincetown, on the tip of the Cape, experiences almost no change in normal tides.
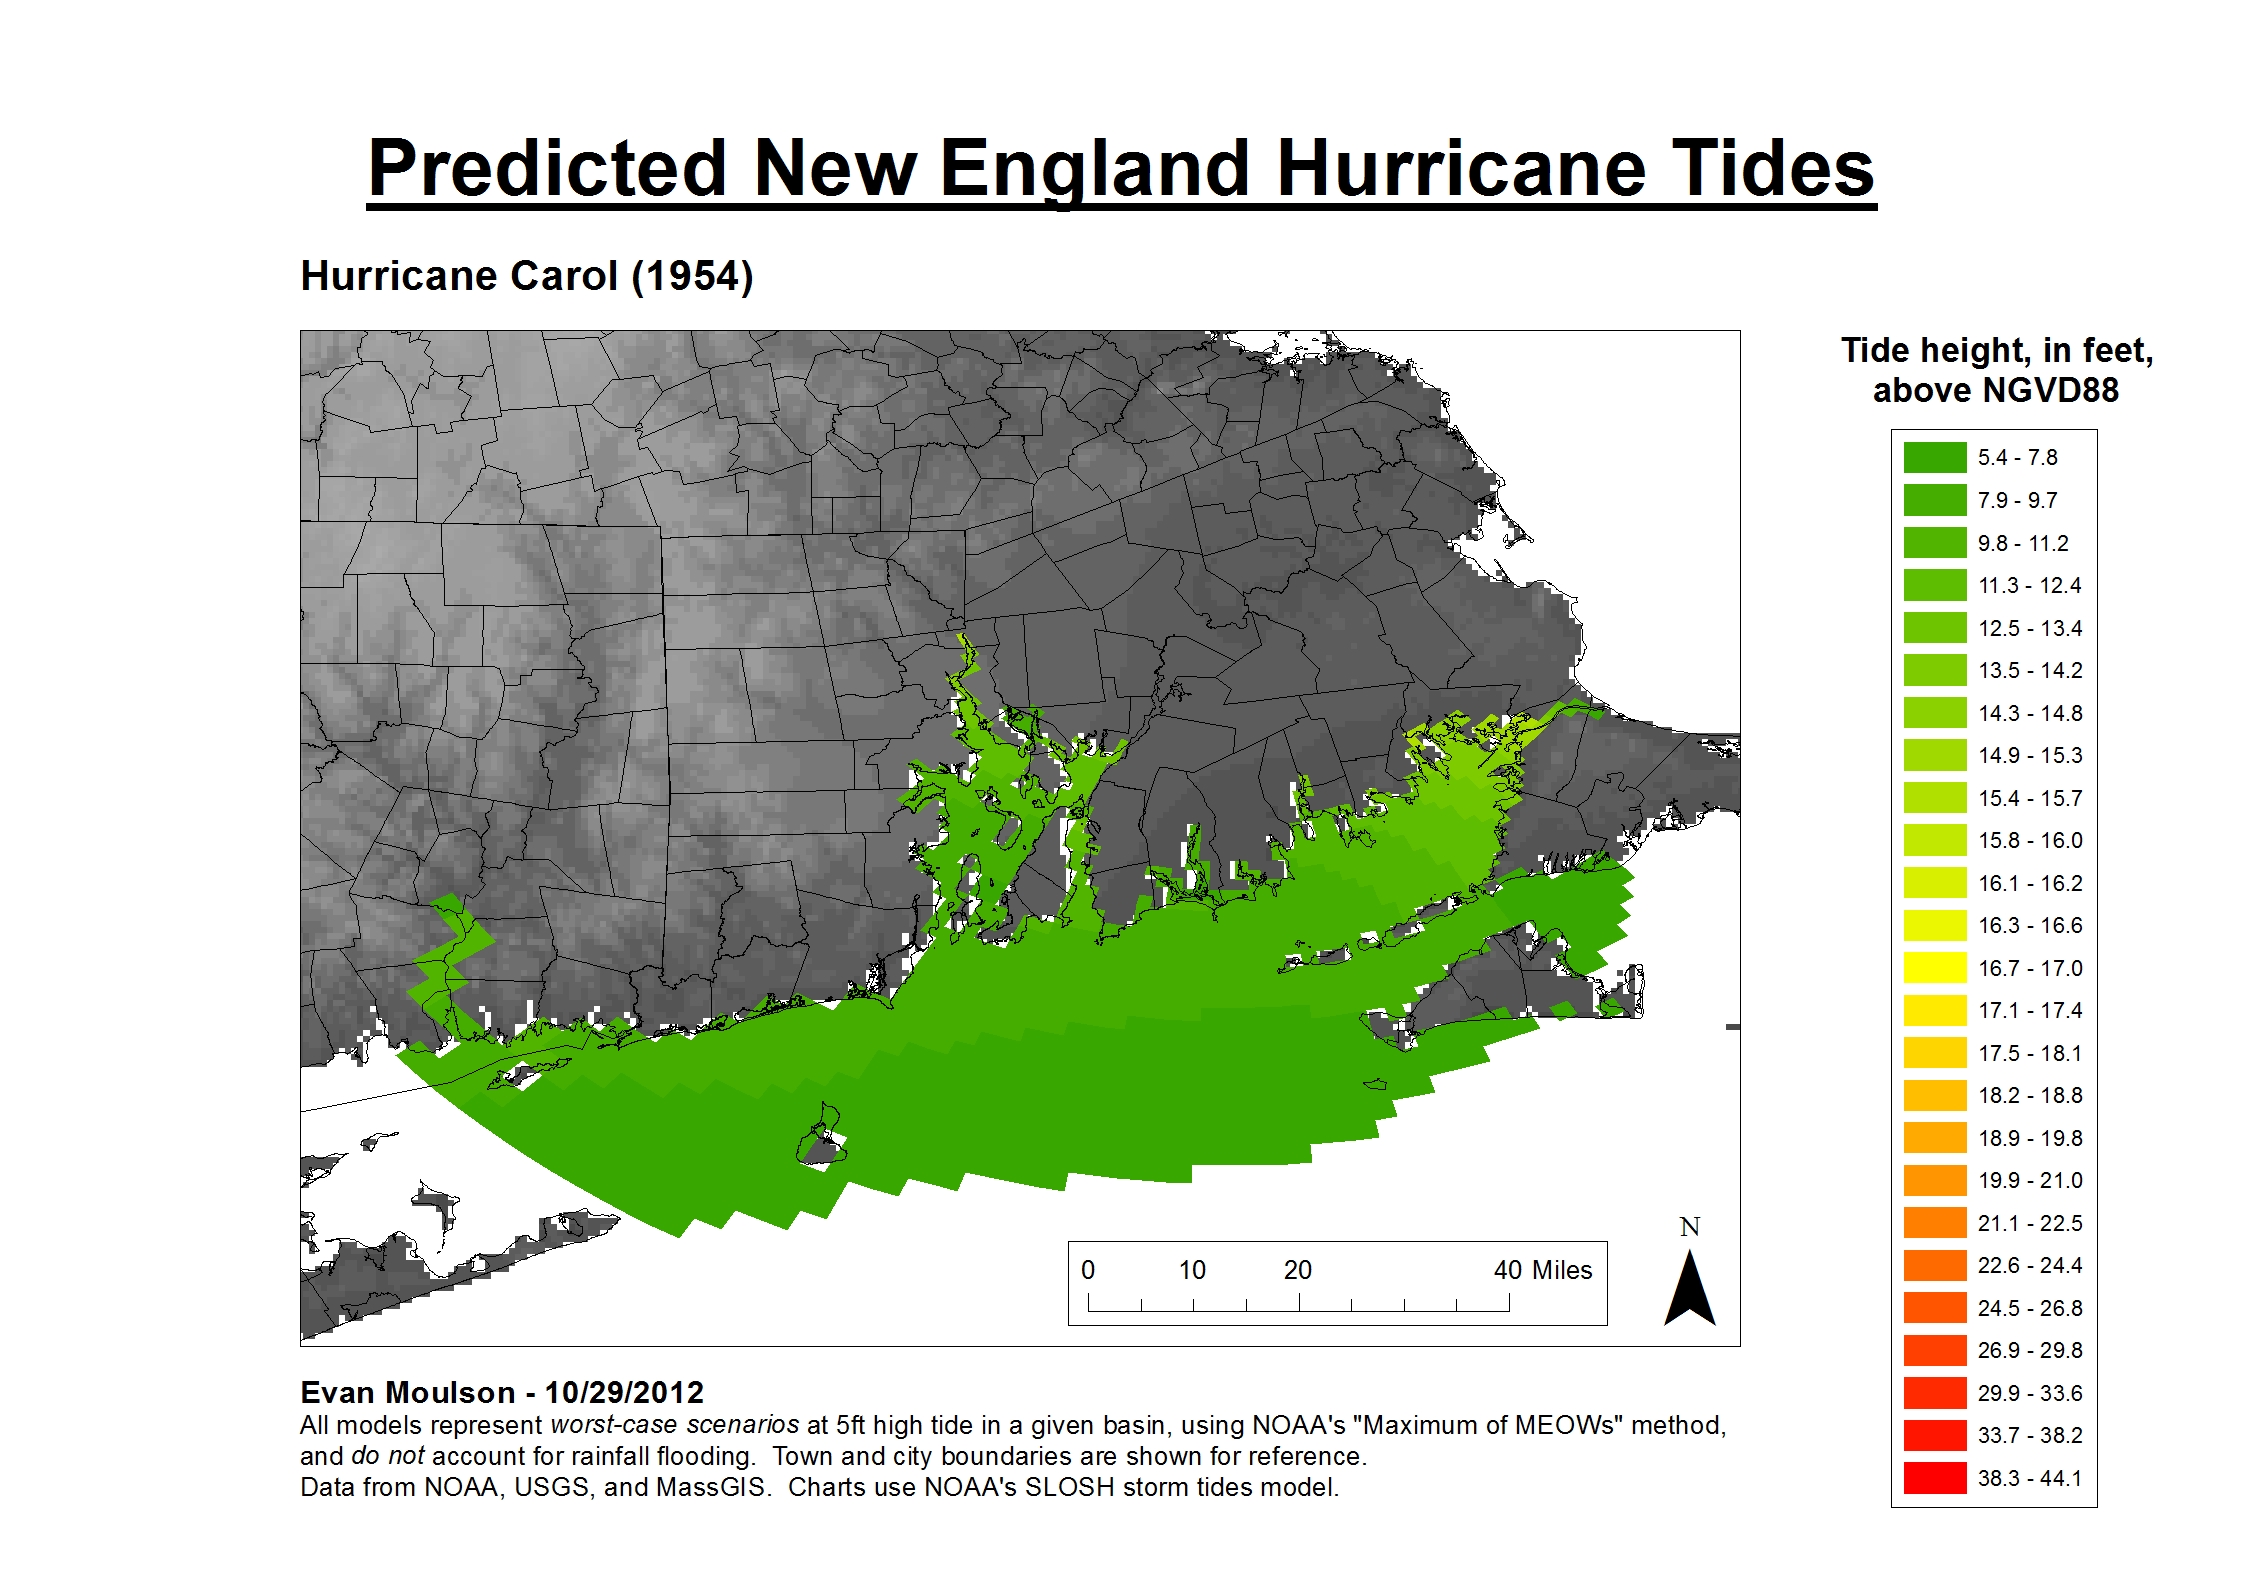
Has a storm like this ever happened?
No, thankfully. Hurricane Carol came close to the SLOSH Cat2 predictions when it made landfall in New York and then Connecticut as a Category 2 storm in 1954. Carol created 14-foot storm surges in Narragansett Bay and flooded downtown Providence with 12 feet of water. This is what Carol’s storm surge looked like, scaled to the SLOSH Cat4 worst-case scenario (data is only available for the Narragansett Bay basin; white areas have no data):
Sandy may have only scratched New England, but if a hurricane ever does set its sights on us, I’ll be on the first evacuation shuttle out.
- This post was originally hosted on the Tufts University blog Jumbo Talk